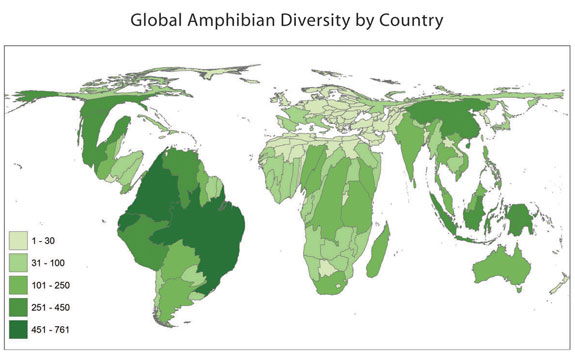
 This map is an example of a cartogram!! A cartogram (while they can vary) is typically defined as a map giving statistical data by means of lines, dots, shaded areas, etc (websters dictionary). The map above is a cartogram that depicts the diversity of the worlds amphibians.
Wednesday, December 3, 2008
Subscribe to:
Post Comments (Atom)
No comments:
Post a Comment